Understand how buildings consume energy, identify waste and use real operational data to support lower costs, improved efficiency and reduced CO2e emissions.
Available from Anders+Kern UK, ecoDriver brings together energy monitoring, dashboards, reporting, sub-metering, IoT sensing and building-control data to provide organisations with a clearer picture of how their buildings are actually performing.
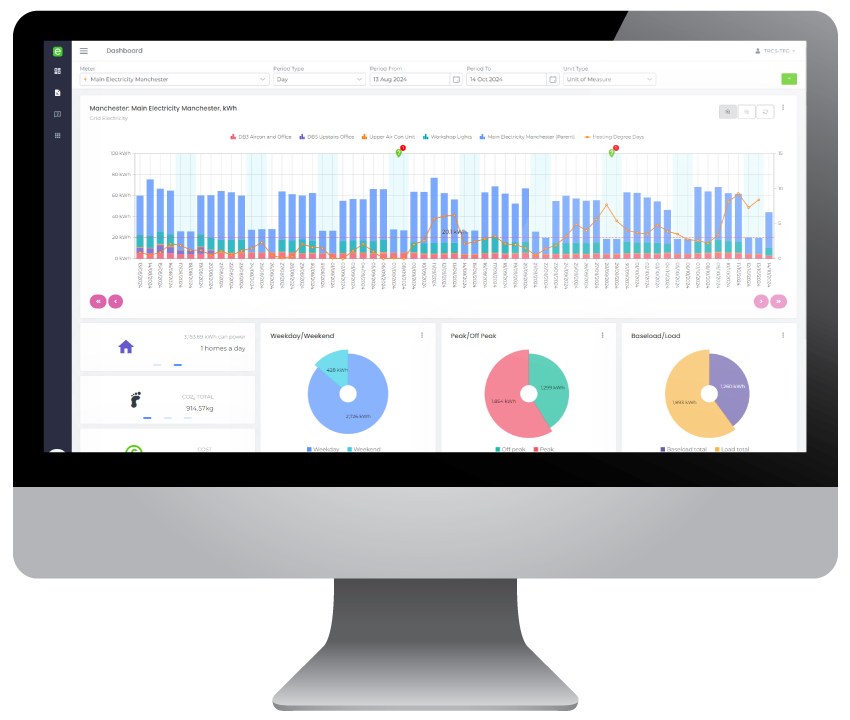
Organisations generate large amounts of energy and operational data, but data alone does not necessarily explain how efficiently a building is operating.
ecoDriver captures information from main fiscal meters, sub-meters, building systems and other data sources so that energy performance can be visualised, analysed and compared over time.
This helps facilities, sustainability and energy teams identify unusual consumption, understand when energy is being used and find opportunities to remove unnecessary waste.
ecoDriver complements A+K's wider Workspace Technologies portfolio by connecting energy performance with occupancy, environmental sensing, IoT and building operation — providing another layer of intelligence around how workplaces and buildings are actually being used.
ecoDriver's approach begins by understanding current building performance before decisions are made about how that performance should be improved.
Understanding energy performance starts with visibility.
ecoDriver can collect interval data from energy meters and present consumption profiles that make unusual operation easier to identify.
Electricity, gas, water and other utility information can be monitored alongside energy generation such as solar, helping organisations build a broader picture of building performance.

ecoDriver is available with different levels of functionality, allowing organisations to begin with core monitoring and reporting before extending into wider energy and building-management workflows.
A straightforward starting point for organisations that want to begin understanding building energy performance.
Builds on the Lite platform with additional tools for collaboration, building operation and wider data management.
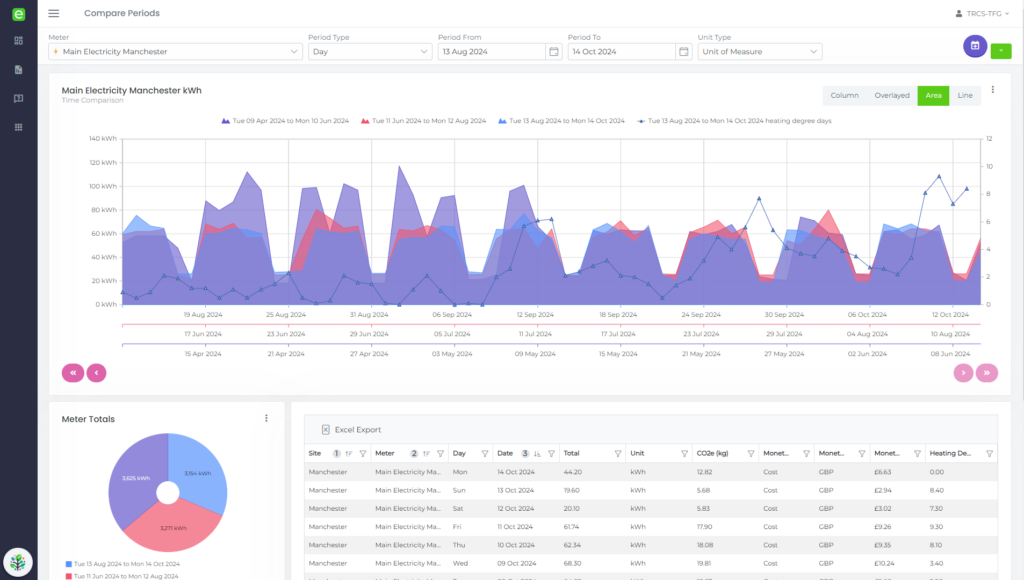
Raw meter data can be difficult to understand without context.
ecoDriver presents energy information through dashboards, charts and reports that help users identify consumption patterns and compare performance across different periods.
Data can also be normalised against measures such as occupancy or gross internal area, helping make comparisons between buildings and spaces more meaningful.
A building's main fiscal meter shows total consumption, but often cannot explain which systems are responsible for it.
Sub-metering provides a more granular view by measuring individual building zones, plant and services.
This can help identify how chillers, boilers, air-handling units, lighting, heat pumps, solar PV and other systems contribute to overall performance.


Energy information becomes more useful when it can be viewed alongside what is happening inside the building.
ecoDriver IoT uses a gateway to capture and securely transfer sensor information to the ecoDriver cloud environment.
This allows energy data to be considered alongside environmental and occupancy information from workplace and building sensors.
Combining energy consumption with occupancy, temperature, air quality and other environmental information can help explain why a building is using energy — not simply how much it has consumed.
ecoDriver BEMS extends the platform into supervisory building control, bringing information from building systems into a single cloud-connected environment.
ecoDriver can form part of a wider smart-building data environment rather than operating as an isolated reporting tool.
Data can be exported for further analysis, while API connectivity allows integration with other business and reporting systems.
A building's energy consumption is closely linked to how spaces are occupied and used.
Combining occupancy information with energy and environmental data can help organisations understand whether building services are operating in line with actual workplace demand.
This creates a natural connection between ecoDriver and A+K's wider workspace technologies, including occupancy sensing, room and desk management, workplace analytics and smart-building IoT.
ecoDriver can support organisations managing individual buildings or larger multi-site estates.
The first version of ecoDriver was developed in 2007. Since then, the platform has evolved around practical experience helping organisations understand energy consumption, identify waste and support ongoing efficiency improvements.
ecoDriver expands the A+K technology portfolio into another important area of the modern workplace: understanding how the building itself is performing.
A+K already brings together workplace management, occupancy, IoT, professional AV and building technology.
ecoDriver adds energy and environmental performance to that picture, giving organisations another source of operational intelligence when making decisions about their buildings and estates.
Whether the requirement begins with basic energy visibility, sub-metering, IoT sensing or a wider smart-building strategy, the platform provides a route from measurement through to continuous improvement.
Improving building efficiency starts with understanding what is happening today.
ecoDriver helps turn utility, meter, sensor and building-system data into information that facilities and energy teams can use.
Dashboards and reports provide visibility, sub-metering adds detail, IoT data provides context and BEMS integration helps connect energy performance with the way the building is actually controlled.
The result is a platform designed not simply to measure energy, but to help organisations identify where performance can be improved and maintain those improvements over time.
Whether you need energy monitoring, building analytics, sub-metering, IoT sensing or a wider smart-building energy-management solution, speak to Anders+Kern about ecoDriver.
Talk to A+K